Monitoring GraphQL Gateways with OpenTelemetry
The Importance of Monitoring and Tracing for GraphQL Gateways
GraphQL Gateways play a crucial role in modern API architectures, acting as the central point for request routing, schema composition, and performance optimization. As these gateways handle increasing amounts of traffic and complexity, monitoring their performance and behavior becomes essential for maintaining reliable and efficient systems.
Current State of GraphQL Gateway Monitoring
Traditionally, monitoring GraphQL Gateways has been challenging due to several factors:
- Distributed Nature: GraphQL Gateways often communicate with multiple subgraphs, making it difficult to trace requests across the entire system.
- Query Planning Complexity: The gateway’s query planning phase, which determines how to split and route queries across subgraphs, is a critical but often opaque process that can significantly impact performance.
- Performance Bottleneck Identification: Complex queries that span multiple subgraphs make it challenging to identify which part of the execution is causing slowness, whether it’s the gateway’s planning, a specific subgraph, or the network communication.
- Error Source Tracing: When errors occur, it’s often difficult to trace whether they originate from the gateway itself, a specific subgraph, or the communication between them, making debugging a complex process.
OpenTelemetry: A Game-Changer for GraphQL Monitoring
OpenTelemetry has emerged as a powerful solution for monitoring GraphQL Gateways, offering:
- Standardized Instrumentation: OpenTelemetry provides consistent APIs for collecting metrics, traces, and logs across different programming languages and frameworks.
- Rich Context: The ability to propagate context across service boundaries helps track requests through the entire system.
- Cross Platform and Languages: OpenTelemetry is available on most languages and platforms, allowing to extend the boundaries of your observable system.
- Vendor Agnostic: OpenTelemetry’s vendor-agnostic approach allows you to choose your preferred observability backend.
New Hive Gateway’s OpenTelemetry Integration
While OpenTelemetry is becoming a widely used solution, we listened to many of production users’s feedback and build the best GraphQL integration possible.
Hive Gateway’s integration of OpenTelemetry have been entirely re-written to better use it’s standard SDK features, and allow for better interoperability with other tools (being custom ones or third party libraries). We’re excited to announce significant improvements to Hive Gateway’s
New cross-runtime simplified configuration helper
You can now enable OpenTelemetry support with just one CLI option! You can easily test our new
integration by providing the [--opentelemetry option of our hive-gateway CLI. You can either
provide a custom endpoint our rely on the standard default OTLP over HTTP exporter.
For more control over the OpenTelemetry setup, we also now provide a cross-runtime
openTelemetrySetup function from @graphql-mesh/plugin-opentelemetry/setup or we support standard
NodeSDK from @opentelemetry/sdk-node for a NodeJS specific setup.
hive-gateway supergraph --opentelemtrySampling
Packed with this new way of configuring OpenTelemetry, we now offer out of the box a Sampling Strategy:
import { openTelemetrySetup } from '@graphql-hive/gateway/opentelemetry/setup'
import { AsyncLocalStorageContextManager } from '@opentelemetry/context-async-hooks'
import { OTLPTraceExporter } from '@opentelemetry/exporter-trace-otlp-http'

openTelemetrySetup({
  contextManager: new AsyncLocalStorageContextManager(),
  traces: {
    exporter: new OTLPTraceExporter({ url: process.env('OTLP_EXPORTER_URL') })
  },
  samplingRate: 0.1 // Only 10% of requests will be traced (or if enabled via context propagation)
})
Limits
To improve the safety of your observability infrastructure, OpenTelemetry’s Limits can now be configured:
import { openTelemetrySetup } from '@graphql-hive/gateway/opentelemetry/setup'
import { AsyncLocalStorageContextManager } from '@opentelemetry/context-async-hooks'
import { OTLPTraceExporter } from '@opentelemetry/exporter-trace-otlp-http'

openTelemetrySetup({
  contextManager: new AsyncLocalStorageContextManager(),
  traces: {
    exporter: new OTLPTraceExporter({ url: process.env('OTLP_EXPORTER_URL') })
    spanLimits: {
      // limits specific to spans, like `eventCountLimit` or `attributeCountLimit`
    },
  },
  generalLimits: {
    // global default limits, like `attributeValueLengthLimit` and `attributeCountLimit`
  }
})
Diagnostic Logs
The OpenTelemetry Diagnostic logs (the internal OpenTelemetry logging system allowing you to debug
your configuration), is now configured to use Hive Gateway logger by default, and follow the
OTEL_LOG_LEVEL standard environment variable.
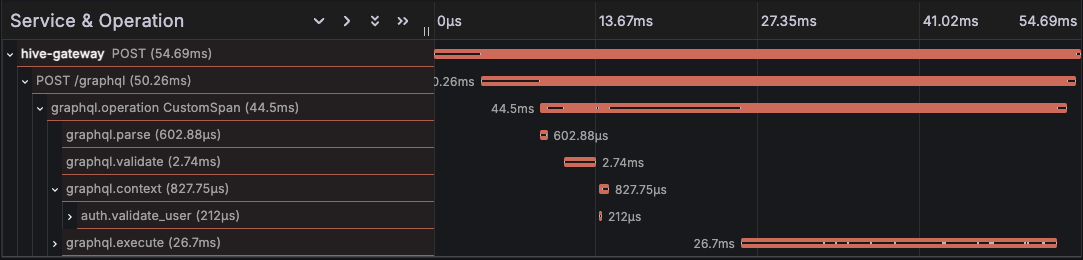
Span parenting and Critical Path Analysis
Spans are now nested within each-other, making it easier to understand execution flow. It also allows the usage of Critical Path Analysis in your visualization tool (like Grafana’s Critical Path Highlighting).
Improved Span coverage
Thanks to a brand new Plugin API, spans are now more precise and covers each phases entirely, including plugins execution time.
You can also instrument plugins if you need to track the performance of a specific plugin.
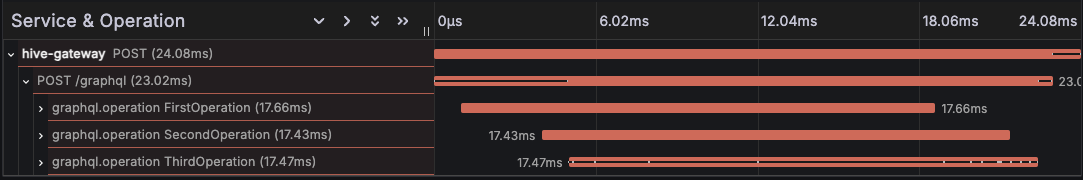
Support of HTTP batching
Our integration now fully support batched queries with the addition of a new graphql.operation
span.
This span represent the processing and execution of a single graphql operation. A single HTTP span can contain multiple graphql operation span in case of a batched HTTP request.
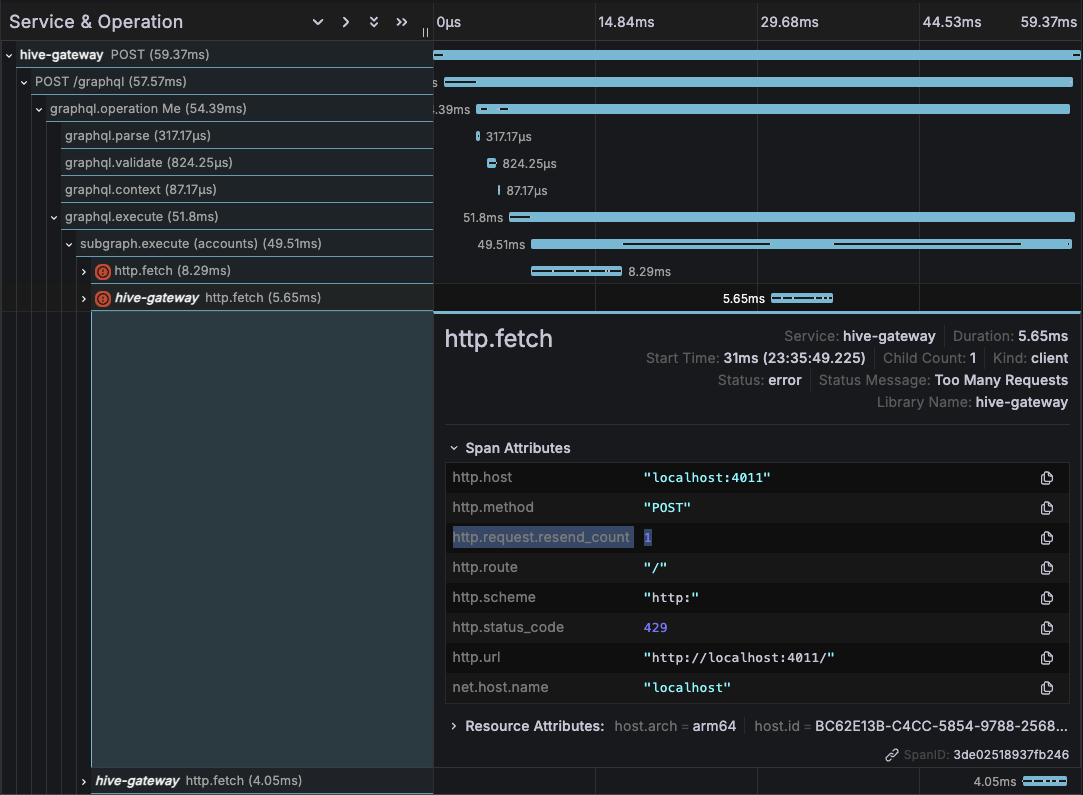
Support of HTTP Retry
In production, upstream subgraph requests are often retirable in case of failure, to improve success rate of the gateway.
Those retry request are now properly registered and the standard http.request.resend_count
attribute is used to indicate a failed retry attempt.
Standard OpenTelemetry Context support
The OpenTelemetry integration now fully support the standard Context, which opens a wide range of new customization possibilities we will see later in this post.
Our integration also have an internal Context Manager, so that span parenting is working on all
runtimes, even those without AsyncLocalStorage API implementation.
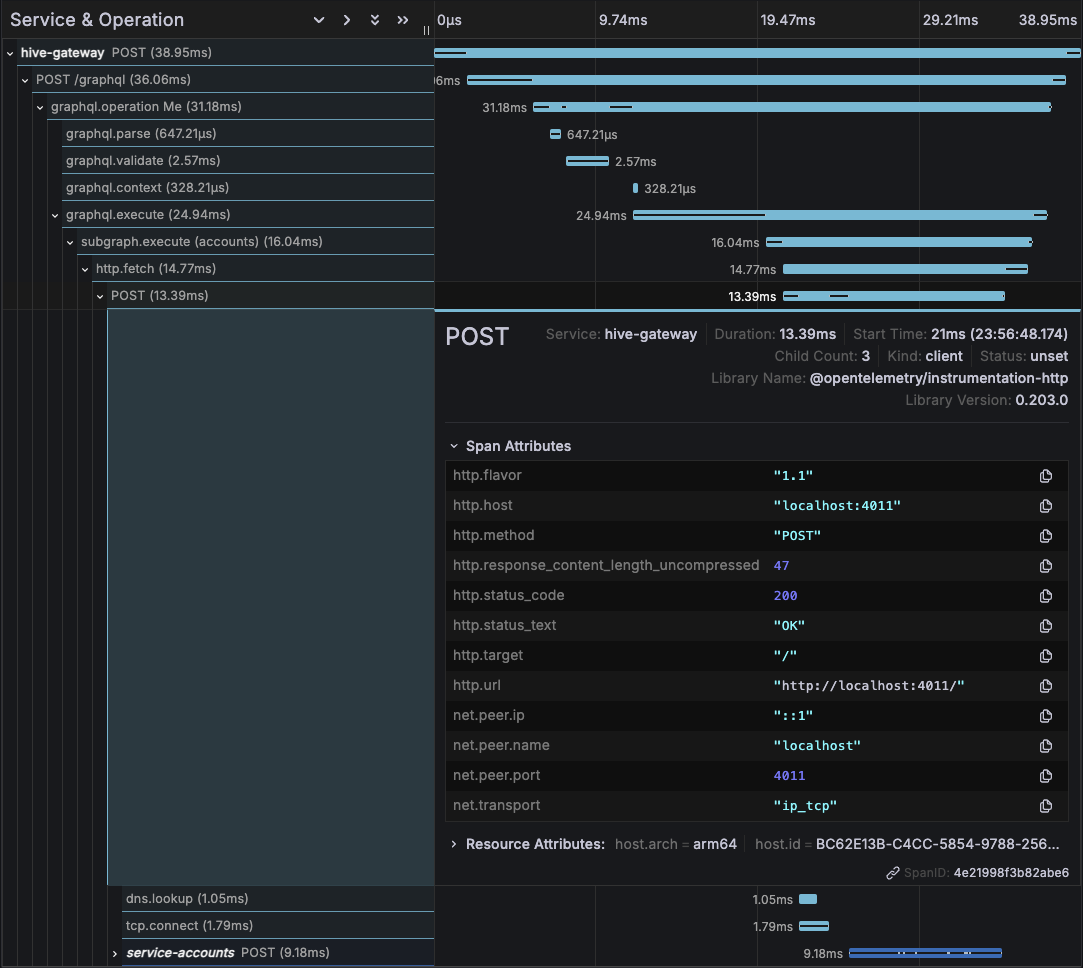
Support of standard instrumentations
Thanks to OpenTelemetry Context, standard instrumentations are now also supported and correctly nested in Hive Gateways’ spans.
This allows you to keep track of performance of low level Node’s internals and usage of third party libraries, such as Databases accesses.
Easier custom spans
You can now easily register custom spans from your custom plugins! Thanks to the standard OpenTelemetry Context, your custom spans will be parented correctly.
import 'telemetry.ts'
import { defineConfig } from '@graphql-hive/gateway'
import { hive, trace } from '@graphql-hive/gateway/opentelemetry/api'
import { getUserFromRequest } from './authentication'

export const gatewayConfig = defineConfig({
  openTelemetry: { traces: true },

  genericAuth: {
    mode: 'protect-granular',
    resolveUserFn: ctx =>
      hive.tracer!.startActiveSpan('auth.validate_user', async span => {
        const token = ctx.request.headers.get('authorization')
        const user = await fetch(`https://auth/validate?token=${token}`).then(r => r.json())
        span.end()
        return user
      })
  }
})
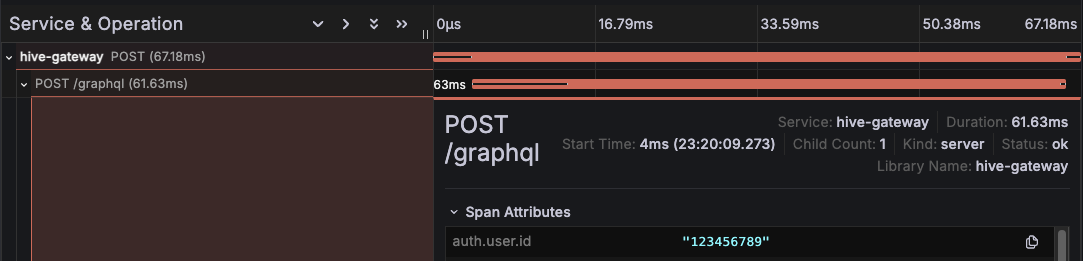
Custom Span Attributes
You can now easily add your own custom attributes to any span using the standard
@opentelemetry/api module.
The most straight forward usage is to add an attribute to the current span, the graphql.execute
span for example:
import 'telemetry.ts'
import { defineConfig } from '@graphql-hive/gateway'
import { trace } from '@opentelemetry/api'

export const defineConfig({
  openTelemetry: { traces: true },
  genericAuth: {
    //...
  }

  plugins: () => [{
    onExecute({ context }) {
      trace.getActiveSpan()?.setAttribute('auth.user.id', context.user.id ?? '<unauthenticated>')
    }
  }]
})
You can also have access to one of the “root” spans (http, graphql operation and subgraph execution) to add or modify there attributes:
import './telemetry.ts'
import { defineConfig } from '@graphql-hive/gateway'
import { hive, trace } from '@graphql-hive/gateway/opentelemetry/api'

export const gatewayConfig = defineConfig({
  openTelemetry: { traces: true },

  genericAuth: {
    mode: 'protect-granular',
    async resolveUserFn(ctx) {
      const token = ctx.request.headers.get('authorization')
      const user = await fetch(`https://auth/validate?token=${token}`).then(r => r.json)

      const httpSpan = trace.getSpan(hive.getHttpContext(ctx.request)
      httpSpan?.setAttribute('auth.user.id', user?.id ?? '<unauthenticated>')

      return user
    }
  }
})
Custom Baggage
OpenTelemetry Baggage allows to attach
data to the current context, allowing to easily enrich future spans. You can now set Baggage using
the new
instrumentation Plugin API:
import './telemetry.ts'
import { defineConfig } from '@graphql-hive/gateway'
import { context, hive, propagation } from '@graphql-hive/gateway/opentelemetry/api'

export const gatewayConfig = defineConfig({
  openTelemetry: { traces: true },
  plugins: () => ({
    instrumentation: {
      request({ request }, wrapped) {
        const requestId = request.headers.get('request-id')
        const baggage = propagation.createBaggage({ requestId })
        const ctxWithBaggage = propagation.setBaggage(hive.getActiveContext({ request }), baggage)

        // The wrapped function represent the processing of the request. It allows you to wrap
        // the entire request pipeline into an other function call, the OTEL context in this case.
        return context.with(ctxWithBaggage, wrapped)
      }
    }
  })
})
Log Correlation
The new OpenTelemetry integration leverage the new Hive Logger feature with an integration with the beta Logger API of OpenTelemetry.
You can now correlate the logs related to a trace for the best debugging experience!
import { defineConfig } from '@graphql-hive/gateway'
import {
  OpenTelemetryLogWriter,
  openTelemetrySetup
} from '@graphql-hive/gateway/opentelemetry/setup'
import { Logger } from '@graphql-hive/logger'
import { AsyncLocalStorageContextManager } from '@opentelemetry/context-async-hooks'
import { OTLPLogExporter } from '@opentelemetry/exporter-logs-otlp-http'
import { OTLPTraceExporter } from '@opentelemetry/exporter-trace-otlp-http'

openTelemetrySetup({
  contextManager: new AsyncLocalStorageContextManager(),
  traces: {
    exporter: new OTLPTraceExporter({ url: process.env('OTLP_EXPORTER_URL') })
  }
})

export const gatewayConfig = defineConfig({
  openTelemetry: { traces: true },
  logging: new Logger({
    writers: [
      new OpenTelemetryLogWriter({
        exporter: new OTLPLogExporter({ url: process.env('OTLP_EXPORTER_URL') })
      })
    ]
  })
})
A unified plugin for Hive Gateway and GraphQL Yoga
Our new OpenTelemetry is not only about Hive Gateway, but is also usable in GraphQL Yoga! You can
use @graphql-mesh/plugin-opentelemetry to improve your GraphQL server observability and take
profit of all the new features presented in this blog post:
import 'telemetry.ts'
import { createServer } from 'node:http'
import { createYoga } from 'graphql-yoga'
import { useOpenTelemetry } from '@graphql-mesh/plugin-opentelemetry'
import { schema } from './schema'

const server = createServer(
  createYoga({
    schema,
    plugins: [useOpenTelemetry({ traces: true })]
  })
)

server.listen(4000, () => {
  console.info('Server is running on http://localhost:4000/graphql')
})
More coming soon!
Our effort to build the best GraphQL Gateway OpenTelemetry integration is not a short journey, and we are preparing more improvement for the future!
We joined the OpenTelemetry Graphql Working Group to push forward the state of GraphQL observability further.
Some problems specific to GraphQl are yet to be solved, and we can’t wait to share the exiting solutions we will build together:
- Subscription traces
- Better error reporting
- Attribute cardinality optimization
- Resolver level spans
- Data access level spans (integration with
DataLoader)
Conclusion
The OpenTelemetry integration we’re releasing today lays the foundation for several exciting future improvements. Thanks to OpenTelemetry’s unified context, logs and traces will be automatically correlated, making it easier to debug errors and performance issues. When a problem occurs, you’ll be able to jump from a slow query trace directly to the relevant logs, providing a complete picture of what happened during problematic requests.
Hive Gateway’s integration brings comprehensive monitoring capabilities to your GraphQL infrastructure. By providing detailed traces, metrics, and logs with unified context, it helps you identify and resolve issues faster, whether they’re in the gateway, subgraphs, or the communication between them.
To learn more about Hive Gateway’s OpenTelemetry integration or to get started with monitoring your GraphQL Gateway, visit our documentation or contact our team.
Join our newsletter
Want to hear from us when there's something new?
Sign up and stay up to date!
*By subscribing, you agree with Beehiiv’s Terms of Service and Privacy Policy.